United States
Securities
And Exchange Commission
Washington, DC 20549
FORM
Current
Report Pursuant to
Section 13 or 15(d) of the
Securities Exchange Act of 1934
Date of report (Date of earliest event reported):
(Exact Name of Registrant as Specified in Charter)
| (State or Other Jurisdiction of Incorporation) | (Commission File Number) | (IRS Employer Identification No.) |
(Address of Principal Executive Offices) (Zip Code)
Registrant’s
telephone number, including area code:
N/A
(Former Name or Former Address, if Changed Since Last Report.)
Securities registered pursuant to Section 12(b) of the Act:
| Title of each class | Trading Symbol(s) | Name of each exchange on which registered |
Check the appropriate box below if the Form 8-K filing is intended to simultaneously satisfy the filing obligation of the registrant under any of the following provisions (see General Instruction A.2. below):
| Written communications pursuant to Rule 425 under the Securities Act (17 CFR 230.425) | ||
| Soliciting material pursuant to Rule 14a-12 under the Exchange Act (17 CFR 240.14a-12) | ||
| Pre-commencement communications pursuant to Rule 14d-2(b) under the Exchange Act (17 CFR 240.14d-2(b)) | ||
| Pre-commencement communications pursuant to Rule 13e-4(c) under the Exchange Act (17 CFR 240.13e-4(c)) |
Indicate by check mark whether the registrant is an emerging growth company as defined in Rule 405 of the Securities Act of 1933 (§ 230.405 of this chapter) or Rule 12b– 2 of the Securities Exchange Act of 1934 (§ 240.12b–2 of this chapter).
Emerging
growth company
If an emerging growth company, indicate by check mark if the registrant has elected not to use the extended transition period for complying with any new or revised financial accounting standards provided pursuant to Section 13(a) of the Exchange Act. ☐
| Item 7.01. | Regulation FD Disclosure. |
Midland States Bancorp, Inc. (the “Company”) is filing an investor presentation (the “Presentation”) that will be used by the Company in meetings with investors and analysts. A copy of the Presentation is attached hereto as Exhibit 99.1 and is incorporated herein by reference.
The information in this Item 7.01 and the attached exhibits shall not be deemed “filed” for purposes of Section 18 of the Securities Exchange Act of 1934, as amended, nor shall they be deemed incorporated by reference in any filing under the Securities Act of 1933, as amended, except as shall be expressly set forth by specific reference in any such filing.
| Item 9.01 | Financial Statements and Exhibits. |
(d) Exhibits
| Exhibit No. | Description | |
| 99.1 | Midland States Bancorp, Inc. Investor Presentation | |
| 104 | Cover Page Interactive Data File (embedded within the Inline XBRL document) |
SignatureS
Pursuant to the requirements of the Securities Exchange Act of 1934, the registrant has duly caused this report to be signed on its behalf by the undersigned hereunto duly authorized.
| Date: March 23, 2022 | Midland States Bancorp, Inc. | |
| By: | /s/ Douglas J. Tucker | |
| Name: | Douglas J. Tucker | |
| Title: | Senior Vice President and Corporate Counsel | |
Exhibit 99.1

1 Midland States Bancorp, Inc. NASDAQ: MSBI Investor Presentation March 2022

2 Forward - Looking Statements. This presentation may contain forward - looking statements within the meaning of the federal securities laws. Forward - looking statements expressing management’s current expectations, forecasts of future events or long - te rm goals may be based upon beliefs, expectations and assumptions of Midland’s management, and are generally identifiable by the use of words such as “believe,” “expect,” “anticipate,” “plan,” “intend,” “estimate,” “may,” “will,” “would,” “could,” “should” o r o ther similar expressions. All statements in this presentation speak only as of the date they are made, and Midland undertakes no obligation to update any statement. A number of factors, many of which are beyond the ability of Midland to control or predic t, could cause actual results to differ materially from those in its forward - looking statements including the effects of the Corona virus Disease 2019 (“COVID - 19”) pandemic, including its potential effects on the economic environment, our customers and our operations, as well as any changes to federal, state or local government laws, regulations or orders in connection with the pandemic. These risks and uncertainties should be considered in evaluating forward - looking statements, and undue reliance shoul d not be placed on such statements. Additional information concerning Midland and its businesses, including additional factors tha t could materially affect Midland’s financial results, are included in Midland’s filings with the Securities and Exchange Commi ssi on. Use of Non - GAAP Financial Measures. This presentation may contain certain financial information determined by methods other than in accordance with accounting principles generally accepted in the United States (“GAAP”). These non - GAAP financial measure s include “Adjusted Earnings,” “Adjusted Pre - Tax, Pre - Provision Income,” “Adjusted Diluted Earnings Per Share,” “Adjusted Return o n Average Assets,” “Adjusted Return on Average Shareholders’ Equity,” “Adjusted Return on Average Tangible Common Equity,” “Adjusted Pre - Tax, Provision Return on Average Assets,” “Efficiency Ratio,” “Tangible Common Equity to Tangible Assets,” “Tangib le Book Value Per Share,” and “Return on Average Tangible Common Equity.” The Company believes that these non - GAAP financial measures provide both management and investors a more complete understanding of the Company’s funding profile and profitability. These non - GAAP financial measures are supplemental and are not a substitute for any analysis based on GAAP financ ial measures. Not all companies use the same calculation of these measures; therefore this presentation may not be comparable to other similarly titled measures as presented by other companies. Reconciliations of these non - GAAP measures are provided in the Appendix section of this presentation.

3 Company Snapshot ▪ $7.4 billion asset community bank established in 1881 and headquartered in Effingham, Illinois » Largest Illinois - based community bank 1 ▪ $4.2 billion Wealth Management business ▪ Commercial bank focused on in - market relationships with national diversification in equipment finance ▪ 52 branches in Illinois and Missouri ▪ 15 successful acquisitions since 2008 Notes: 1) Community bank defined as banks with less than $10 billion in assets; Source: S&P Capital IQ 2) All financial data as of December 31, 2021

4 Financial Services & Banking Center Footprint

5 Notes: 1. As of December 31, 2021 Investment Summary Consistent track record of driving compelling shareholder returns through disciplined strategic expansion and earnings growth Well diversified loan portfolio across asset classes, industries and property types Organization - wide focus on expense management driving improvement in operating efficiencies Attractive , stable core deposit franchise with 37% non - interest bearing accounts 1 Illinois and contiguous states provide ample opportunities for future acquisitions Proven track record of successful acquisitions with a focus on enhancing shareholder value while building a platform for scalability Leveraging technology to drive revenue growth, increase market share, and enhance the customer experience 37 %

6 Business and Corporate Strategy Customer - Centric Culture Drive organic growth by focusing on customer service and accountability to our clients and colleagues; seek to develop bankers who create dynamic relationships; pursue continual investment in people; maintain a core set of institutional values, and build a robust technology platform that provides customers with a superior banking experience Operational Excellence A corporate - wide focus on driving improvements in people, processes and technology in order to generate further improvement in Midland’s operating efficiency and financial performance Enterprise - Wide Risk Management Maintain a program designed to integrate controls, monitoring and risk - assessment at all key levels and stages of our operations and growth; ensure that all employees are fully engaged Accretive Acquisitions Maintain experienced acquisition team capable of identifying and executing transactions that build shareholder value through a disciplined approach to pricing; take advantage of relative strength in periods of market disruption Revenue Diversification Generate a diversified revenue mix and focus on growing businesses that generate strong recurring revenues such as wealth management

7 Jeffrey G. Ludwig | President and CEO of Midland States Bancorp ▪ Assumed Company CEO role in Jan. 2019 after serving as Bank CEO ▪ More than 10 years serving as CFO ▪ Joined Midland in 2006; 16+ years in banking industry Jeffrey S. Mefford | President of Midland States Bank and EVP of Midland States Bancorp ▪ Joined Midland in 2003 ▪ Appointed Bank President in March 2018 ▪ Oversees all sales activities for commercial, retail, mortgage, wealth management, equipment finance, and treasury management Douglas J. Tucker | SVP, Corporate Counsel and Director of IR ▪ 20 + years experience advising banks and bank holding companies ▪ Significant IPO, SEC reporting and M&A experience ▪ Joined Midland in 2010 Eric T. Lemke | Chief Financial Officer ▪ Promoted to Chief Financial Officer in November 2019 ▪ Joined Midland in 2018 as Director of Assurance and Audit ▪ 25+ years of financial accounting and reporting experience in financial services Jeffrey A. Brunoehler | Chief Credit Officer ▪ 30+ years in banking, lending and credit ▪ Leads the credit underwriting, approval and loan portfolio management functions ▪ Joined Midland in 2010 Experienced Senior Management Team

8 Strategic Capital Bank AMCORE Bank, N.A. Love Savings / Heartland Bank Sterling Bancorp Centrue Financial Alpine Bancorp. HomeStar Financial Acquisition Type FDIC - Assisted 12 Branches Whole Bank Trust Administration Whole Bank Whole Bank and Wealth Mgmt Whole Bank Assets Acquired ($mm) $540.4 $499.5 $889.0 - $990.2 $1,243.3 $366.0 Location Champaign, IL Northern Illinois St. Louis, MO Yonkers, NY Northern Illinois Rockford, IL Kankakee, IL Successful Acquisition History Financially Transformative Operationally Transformative Revenue Diversification 2010 2009 2016 2014 2017 Enhanced Scale and Market Presence Selected Acquisitions 2018 Expanded Core Bank and Wealth Management 2019 Low - cost Deposit Franchise and Market Presence Expansion of Trust Business ▪ Midland States has completed 15 transactions since 2008, including FDIC - assisted, branch, whole bank, asset purchase and business line acquisitions, and a New York trust asset acquisition ▪ Demonstrated history of earnings expansion ▪ Deliberate diversification of geographies and revenue channels ▪ Successful post - closing integration of systems and businesses

9 (1) All data as of or for the three months ended December 31, 2021 Overview of Pending FNBC Branch Acquisition Key Highlights ▪ Acquiring one branch and the deposits and certain loans from two FNBC Bank & Trust locations ▪ Adds branch in Mokena, IL ▪ Increases Midland’s exposure to faster growing markets in Northern Illinois ▪ Improves ability to capitalize on new client and talent acquisition opportunities created by bank merger activity in Chicago MSA ▪ Expected to close in Q2 2022 Financial Impact (1) ▪ Adds attractively priced core deposits ▪ ~$86 million of deposits ▪ More than 35% of deposits are noninterest - bearing accounts ▪ Cost of deposits of less than 0.10% ▪ Adds ~$26 million in loans ▪ Slightly accretive to earnings on an immediate basis Extends Footprint Closer to Chicago

10 Successful Execution of Strategic Plan… Total Assets (at period - end in Billions) CAGR: 17% Selected Acquisitions: Total Assets at Time of Acquisition (in millions) 2009: Strategic Capital Bank ($540) 2010: AMCORE Bank ($500) 2014: Love Savings/Heartland Bank ($889) 2017: Centrue Financial ($990) 2018: Alpine Bancorp. ($1,243) 2019: HomeStar Financial Group ($366) $1.1 $1.6 $1.5 $1.6 $1.7 $2.7 $2.9 $3.2 $4.4 $5.6 $6.1 $6.9 $7.4 2009 2010 2011 2012 2013 2014 2015 2016 2017 2018 2019 2020 2021 Selected Acquisitions

11 $13.82 $15.20 $17.16 $17.31 $17.00 $18.64 $19.31 $21.66 2014 2015 2016 2017 2018 2019 2020 2021 …Leads to Creation of Shareholder Value Note: (1) Tangible book value per share is a non - GAAP financial measure; tangible book value per share is defined as tangible common equit y divided by shares of common stock outstanding; please refer to the reconciliation in the Appendix Tangible Book Value Per Share (1) (at period - end) Dividends Declared Per Share 22 Consecutive Years of Dividend Increases (annualized) $0.59 $0.65 $0.72 $0.80 $0.88 $0.97 $1.07 $1.12 $1.16 2014 2015 2016 2017 2018 2019 2020 2021 2022 (annualized) CAGR: 6.6% CAGR: 8.8%
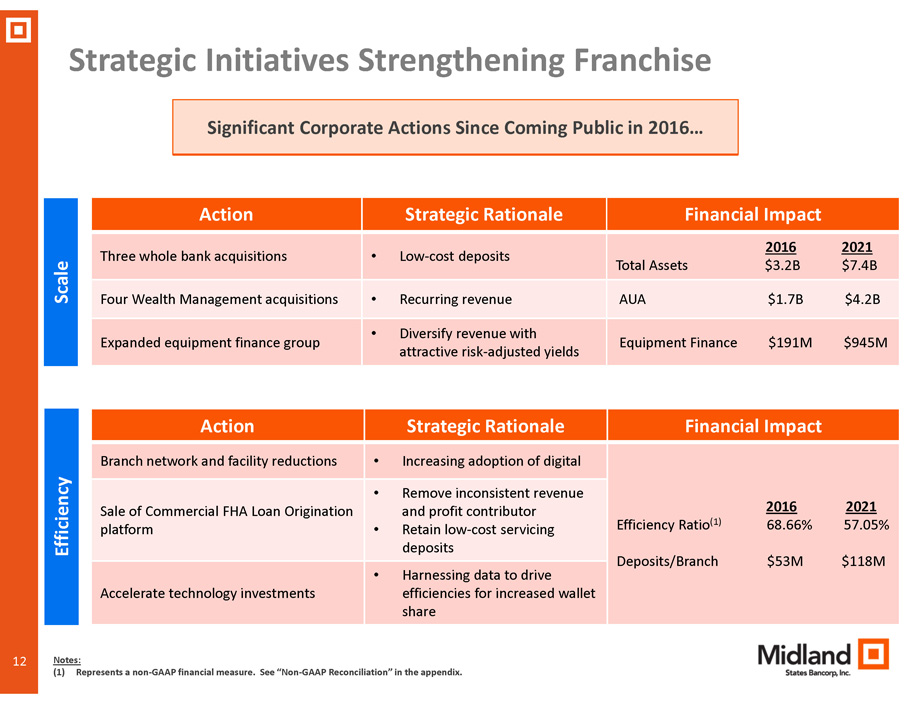
12 Strategic Initiatives Strengthening Franchise Action Strategic Rationale Financial Impact Three whole bank acquisitions • Low - cost deposits 2016 2021 Total Assets $3.2B $7.4B Four Wealth Management acquisitions • Recurring revenue AUA $1.7B $4.2B Expanded equipment finance group • Diversify revenue with attractive risk - adjusted yields Equipment Finance $191M $945M Significant Corporate Actions Since Coming Public in 2016… Notes: (1) Represents a non - GAAP financial measure. See “Non - GAAP Reconciliation” in the appendix. Action Strategic Rationale Financial Impact Branch network and facility reductions • Increasing adoption of digital 2016 2021 Efficiency Ratio (1) 68.66% 57.05% Deposits/Branch $53M $118M Sale of Commercial FHA Loan Origination platform • Remove inconsistent revenue and profit contributor • Retain low - cost servicing deposits Accelerate technology investments • Harnessing data to drive efficiencies for increased wallet share Scale Efficiency

13 Strategic Initiatives Strengthening Franchise …Have Produced Improved Growth and Profitability Total Loans $2,320 $3,227 $4,138 $4,401 $5,103 $5,225 2016 2017 2018 2019 2020 2021 (in millions, as of year - end) Wealth Management Revenue $8.09 $13.34 $20.51 $21.83 $22.80 $26.81 2016 2017 2018 2019 2020 2021 (in millions) Adjusted Pre - Tax Pre - Provision Earnings (1) Efficiency Ratio (1) $50.1 $61.9 $83.7 $101.3 $108.9 $120.4 2016 2017 2018 2019 2020 2021 68.66% 66.66% 66.08% 61.53% 59.42% 57.05% 2016 2017 2018 2019 2020 2021 Notes: (1) Represents a non - GAAP financial measure. See “Non - GAAP Reconciliation” in the appendix.

14 Foundational Consumer Small Business Commercial Customer Facing Digital Talent (39 FTE) Chief Digital Officer , Director – Digital Customer Experience, Director – Enterprise Data Services, Director – Digital Solution Delivery, Lead Engineer API Development, Senior Manager – Digital Marketing, Manager – Customer Experience, Board Member – Digital Expertise, Web Development Wealth Centralized Data Analytics – Informatica, PowerBI , SAS Viya (2018, 2019, 2020) Oracle data warehouse with 98% of data accessible for analytics across all products, services and channels. Artificial Intelligence (2020, 2021) 200+ RPA “bots” deployed in the last 18 months, AI based solutions applied in Risk Management, Mortgage Operations (Q2 2021), and Cyber Security (UEBA) CX Platform Customer Feedback (2020, 2021) Fintech Partnerships Established Canapi Fund, Alloy, Blend, Plaid, GreenSky, JAM/FINTOP Fund, Informatica Silo - elimination and 360 view of customer (2020) All sales teams on single sales platform using same 360 view of customer Near real time payments (Q1 2021) Online loan Origination (Q1 2021) Consumer online account opening (2020) Automated analytics - based marketing platform deployed with access to all datasets and all businesses (2020 and on - going) CRM deployed to 600+ front office employees with rich view of the customer, automated leads, and single view of pipelines for executive team (2020) Retail Banking Needs Navigator & Customer Incentive Programs (2020) Self service loan portal and treasury on - boarding ( 2021) Commercial Relationship pricing optimization engine (Q1 2022) SBA Loan Portal (Opening Dec 2021) Technology Roadmap Midland’s technology investments are enhancing efficiencies, improving client experience, and positively impacting retail deposit gathering and commercial/consumer loan production Commercial Online Account Opening (Q4 2021) Integrated Payables – Payments (Q4 2021) Online Access and Portal (Q4 2021) Flexible Overdrafts (Q1 2022)

15 Loan Portfolio and Asset Quality

16 Commercial Loans and Leases by Industry RE / Rental & Leasing 21.9% Assisted Living 12.2% All Others 12.1% Construction - General 7.6% Finance and Insurance 7.1% Manufacturing 7.0% Accommodation & Food Svcs 6.2% Ag., Forestry, & Fishing 4.8% Trans. / Ground Passenger 4.8% Retail Trade 4.1% General Freight Trucking 4.1% Other Services 2.9% Wholesale Trade 2.8% Health Care 2.4% Industries as a percentage of Commercial, CRE and Equipment Finance Loans and Leases as of 12/31/21

17 Commercial Real Estate Portfolio by Collateral Type Retail 16.6% Skilled Nursing 13.4% Multi - Family 9.8% Assisted Living 9.4% Hotel/Motel 8.3% Industrial / Warehouse 7.8% Office 6.6% All Others 5.1% Residential 1 - 4 Family 4.0% Farmland 3.4% C - Store / Gas Station 3.3% Mixed Use / Other 2.8% Special Purpose 2.5% Developed Land 2.1% Medical Building 2.0% Raw Land 1.6% Restaurant 1.3% Collateral type as a percentage of the Commercial Real Estate and Construction Portfolio as of 12/31/21 CRE Concentration (as of 12/31/21) CRE as a % of Total Loans 34.8% CRE as a % of Total Risk - Based Capital (1) 212.7% Notes: (1) Represents non - owner occupied CRE loans only

18 Accelerating Commercial Loan Growth » New hires and an increase in productivity of the commercial banking group without increasing the size of the business development team » Addition of expertise in specialty finance, agribusiness and SBA » Increased exposure to higher growth markets in Northern Illinois and St. Louis » Successfully moving up market and working with larger clients that have greater financing needs » Effectively leveraging technology investments, including the Salesforce platform, to improve win rate and expand relationships with clients Notes: 1) Excluding PPP loans and commercial FHA warehouse lines of credit 23% Annualized Loan Growth in Second Half of 2021 (1) Commercial and CRE Loan Production $313 $417 $289 $858 1Q 2021 2Q 2021 3Q 2021 4Q 2021 New Loan Fundings New Unfunded Commitments ($ in millions)

19 Midland Equipment Finance Portfolio Overview ($ in millions) Portfolio Characteristics (as of 12/31/21) Nationwide portfolio providing financing solutions to equipment vendors and end - users Total Outstanding Loans and Leases $945.2 million (18.1% of total loans) Number of Loans and Leases 7,896 Average Loan/Lease Size $119,713 Largest Loan/Lease $1.2 million Weighted Average Rate 4.74% Representative Industries Served Manufacturing, General Freight Trucking, Construction, Transit and Ground Passenger Avg. FICO Score 604 Equipment Finance Outstanding Balances $376 $632 $862 $945 2018 2019 2020 2021

20 GreenSky Consumer Loan Portfolio Overview Delinquency Rate (greater than 60 days) Portfolio Characteristics (as of 12/31/21) Total Outstanding $874.5 million (16.7% of total loans) Number of Loans 412,663 Average Loan Size $2,119 Average FICO Score 771 Total Deferred Loans (as of September 30, 2021) $0.7 million (0.1% of portfolio) Total Deferred Loans (as of December 31, 2021) $0.5 million (0.1% of portfolio) ▪ Average FICO score of 771 ▪ No losses to MSBI in 10 year history of portfolio Prime Credit 0.36% 0.35% 0.23% 0.25% 0.26% Dec 2020 Mar 2021 Jun 2021 Sep 2021 Dec 2021 ▪ Cash flow waterfall structure » Cash flow from portfolio covers servicing fee, credit losses and our target margin » Excess cash flow is an incentive fee to GreenSky that is available to cover additional losses » GreenSky received incentive fees in 35 of past 36 months including every month in 2020 and 2021 ▪ Escrow deposits » Escrow deposits absorb losses in excess of cash flow waterfall » Escrow account totaled $34.8 million at 12/31/21 or 4.0% of the portfolio Credit Enhancement

21 Asset Quality NCO / Average Loans • Nonperforming loans decreased $12.0 million primarily due to the payoff of two non - accrual loans and the charge - off of a third non - accrual loan • Net charge - offs of $4.6 million, or 0.37% of average loans • Charge - offs primarily related to one acquired loan and equipment finance credits • Provision for credit losses of $0.5 million primarily related to an increase in the reserve for unfunded commitments resulting from strong commercial loan production Nonperforming Loans / Total Loans (Total Loans as of quarter - end) 1.06% 1.08% 1.27% 1.11% 0.81% 4Q 2020 1Q 2021 2Q 2021 3Q 2021 4Q 2021 0.19% 0.14% 0.33% 0.25% 0.37% 4Q 2020 1Q 2021 2Q 2021 3Q 2021 4Q 2021

22 Changes in Allowance for Credit Losses ACL 9/30/21 ACL 12/31/21 ($ in thousands) Specific Reserves Portfolio Changes Economic Factors ▪ Changes to specific reserves ▪ New loans ▪ Changes in credit quality including risk ratings and deferrals ▪ Changes in allocations to COVID - 19 impacted segments ▪ Aging of existing portfolio ▪ Other charge - offs and recoveries ▪ Changes to macro - economic variables and forecasts ▪ Changes to other economic qualitative factors

23 ACL by Portfolio Portfolio Total Loans at 12/31/21 ACL % of Total Loans Total Loans at 9/30/21 ACL % of Total Loans Commercial $ 770,670 $ 5,783 0.75% $ 799,189 $ 6,360 0.80% Warehouse Lines 91,927 - 0.00% 180,248 - 0.00% Commercial Other 679,518 8,592 1.26% 668,146 8,231 1.23% Equipment Finance 521,973 8,262 1.58% 486,623 7,856 1.61% Paycheck Protection Program 52,477 79 0.15% 82,410 124 0.15% Lease Financing 423,280 7,469 1.76% 412,430 7,586 1.84% CRE non - owner occupied 1,105,333 14,771 1.34% 921,344 17,943 1.95% CRE owner occupied 469,658 5,941 1.26% 437,140 6,855 1.57% Multi - family 171,875 1,740 1.01% 128,961 1,591 1.23% Farmland 69,962 541 0.77% 74,568 564 0.76% Construction and Land Development 193,749 972 0.50% 200,792 1,131 0.56% Residential RE First Lien 274,412 2,314 0.84% 277,819 2,551 0.92% Other Residential 63,738 381 0.60% 66,595 466 0.70% Consumer 106,008 307 0.29% 77,132 268 0.35% Consumer Other (1) 896,598 2,251 0.25% 851,438 2,129 0.25% Total Loans 5,224,801 51,062 0.98% 4,915,554 55,675 1.13% Loans (excluding GreenSky, PPP and warehouse lines) 4,148,188 48,608 1.17% 3,745,257 53,253 1.42% ($ in thousands) Notes: (1) Primarily consists of loans originated through GreenSky relationship

24 Recent Financial Trends

25 Overview of 4Q21 25 Positive Trends in Key Metrics 4Q21 Earnings Improvement in Asset Quality • Noninterest - bearing deposits increased to 36.8% of total deposits • Cost of deposits declined 4 bps from prior quarter to 0.15% • Wealth Management AUA increased 3.9% from the end of the prior quarter • Efficiency ratio (1) improved to 52.61% from 58.78% in prior quarter • Nonperforming loans declined 22.0% from the end of the prior quarter • ACL/NPLs increased to 120% from 102% at the end of the prior quarter Strong Inflows of Low - Cost Deposits • Total deposits increased 9.1% from the end of the prior quarter • Noninterest - bearing deposits increased 34.2% from the end of the prior quarter • Increases primarily driven by commercial FHA servicing deposits and other commercial deposits • Net income of $23.1 million, or $1.02 diluted EPS • 4Q21 results included a $4.9 million FHLB advance prepayment penalty and a $1.8 million gain on termination of interest rate swap • Adjusted pre - tax, pre - provision earnings (1) of $36.3 million, up from $28.4 million in prior quarter Notes: (1) Represents a non - GAAP financial measure. See “Non - GAAP Reconciliation” in the appendix. Record Quarter of Loan Production • Total loans increased 25.2% annualized • CRE loans, including multifamily, increased $255 million from the end of the prior quarter • Total commercial loans and leases, excluding PPP and commercial FHA warehouse lines, increased $112 million from the end of the prior quarter

26 Loan Portfolio Total Loans and Average Loan Yield • Total loans increased $309.2 million from prior quarter to $5.22 billion • Growth in CRE loans, conventional commercial loans, and consumer loans offset lower end of period balances on commercial FHA warehouse credit lines and lower PPP loans • Equipment finance balances increased $46.2 million, or 5.1% from end of prior quarter • Excluding PPP loans, commercial FHA warehouse credit lines, and loans added through GreenSky partnership, total loans increased at an annualized rate of more than 40% during 4Q21 • PPP loans were $52.5 million at Dec. 31, 2021, a decrease of $29.9 million from Sep. 30, 2021 Loan Portfolio Mix (in millions, as of quarter - end) (in millions, as of quarter - end) $5,103 $4,911 $4,836 $4,916 $5,225 4.58% 4.50% 4.43% 4.42% 4.36% 4Q 2020 1Q 2021 2Q 2021 3Q 2021 4Q 2021 Total Loans Average Loan Yield 4Q 2021 3Q 2021 4Q 2020 Commercial loans and leases $ 1,873 $ 1,880 $ 2,096 Commercial real estate 1,817 1,562 1,526 Construction and land development 194 201 173 Residential real estate 338 344 443 Consumer 1,003 929 866 Total Loans $5,225 $4,916 $5,103 Total Loans ex. Commercial FHA Lines and PPP $5,080 $4,653 $4,646

27 Total Deposits Total Deposits and Cost of Deposits • Total deposits increased $509.3 million, or 9.1% from prior quarter, to $6.11 billion • Increase in deposits largely attributable to increase in commercial FHA servicing deposits and other commercial deposits • Noninterest - bearing deposits increased to 36.8% of total deposits at Dec. 31, 2021 Deposit Mix (in millions, as of quarter - end) (in millions, as of quarter - end) $5,101 $5,341 $5,196 $5,601 $6,111 0.26% 0.25% 0.23% 0.19% 0.15% 4Q 2020 1Q 2021 2Q 2021 3Q 2021 4Q 2021 Total Deposits Cost of Deposits 4Q 2021 3Q 2021 4Q 2020 Noninterest - bearing demand $ 2,246 $ 1,673 $ 1,470 Interest - bearing: Checking 1,663 1,697 1,569 Money market 869 853 786 Savings 679 666 598 Time 631 689 656 Brokered time 23 24 23 Total Deposits $6,111 $5,601 $5,101

28 • Net interest income increased 5.7% from the prior quarter due primarily to higher average earning assets • Net interest margin, excluding accretion income, decreased 6 bps from prior quarter due primarily to an increase in liquidity resulting from growth in commercial FHA servicing deposits • Cash and cash equivalents represented 10% of interest - earning assets at Dec. 31, 2021 • Redeployment of excess liquidity into higher yielding earning assets will support net interest margin going forward Net Interest Income/Margin Net Interest Margin Net Interest Income (in millions) $1.6 $1.2 $1.3 $1.0 $0.8 $53.5 $51.9 $50.1 $51.4 $54.3 4Q 2020 1Q 2021 2Q 2021 3Q 2021 4Q 2021 NII Accretion Income 0.10% 0.08% 0.09% 0.07% 0.04% 3.47% 3.45% 3.29% 3.34% 3.25% 4Q 2020 1Q 2021 2Q 2021 3Q 2021 4Q 2021 NIM Accretion Income

29 • During 4Q21, assets under administration increased $159.2 million, primarily due to market performance • Wealth Management revenue was consistent with prior quarter, as a decrease in estate and guardianship fees offset the increase in AUA Wealth Management Wealth Management Revenue Assets Under Administration (in millions) (in millions ) $3,481 $3,560 $4,078 $4,058 $4,217 4Q 2020 1Q 2021 2Q 2021 3Q 2021 4Q 2021 $5.87 $5.93 $6.53 $7.18 $7.18 4Q 2020 1Q 2021 2Q 2021 3Q 2021 4Q 2021

30 Noninterest Income • Noninterest income increased 48.7% from prior quarter • Impairment on commercial MSRs impacted noninterest income by $2.1 million and $3.0 million in 4Q21 and 3Q21, respectively • Excluding the impact of the impairment of commercial MSRs, noninterest income increased 35.3% primarily due to gains on BOLI and the termination of an FHLB interest rate swap, as well as unrealized income on equity investments Noninterest Income (in millions) $14.3 $14.8 $17.4 $15.1 $22.5 4Q 2020 1Q 2021 2Q 2021 3Q 2021 4Q 2021 All Other Residential Mortgage Wealth Management

31 Noninterest Expense and Operating Efficiency • Efficiency Ratio (1) was 52.6% in 4Q21 vs. 58.8% in 3Q21 • Adjustments to non - interest expense: • Excluding these adjustments, noninterest expense decreased $0.3 million • Operating expense run - rate expected to be $40.5 - $41.5 million in 2022 Noninterest Expense and Efficiency Ratio (1) (Noninterest expense in millions) Notes: (1) Represents a non - GAAP financial measure. See “Non - GAAP Reconciliation” in the appendix. ($ in millions) 4Q21 3Q21 Integration and acquisition related expenses ($0.2) ($0.2) FHLB advance prepayment fee ($4.9) -- Loss on MSRs held for sale -- ($0.1) $5.7 $0.2 $7.6 $0.3 $5.0 $47.0 $39.1 $48.9 $41.3 $45.8 58.6% 57.1% 60.2% 58.8% 52.6% 50.0% 55.0% 60.0% 65.0% 70.0% $20.0 $25.0 $30.0 $35.0 $40.0 $45.0 $50.0 $55.0 4Q 2020 1Q 2021 2Q 2021 3Q 2021 4Q 2021 Total Noninterest Expense Adjustments to Noninterest Expense Efficiency Ratio

32 Outlook

33 2022 Outlook and Priorities • Current expectation is to now continue participation in GreenSky partnership through at least 2023 » New fintech partnership should provide $200 - $250 million in loans over next 2 - 3 years • High - single - digit loan growth expected in 2022 » Continued momentum of more productive commercial banking group including specialty finance • Continue increasing presence in higher growth markets in St. Louis and Northern Illinois, including the Chicagoland area • Improve positioning to benefit from rising interest rates » Asset sensitivity is steadily increasing as commercial banking group generates higher levels of variable rate loans and noninterest - bearing deposits • Maintain stable expense levels while continuing to invest in technology » Shift focus of technology investments from foundational to revenue generating • Evaluate small, strategic M&A opportunities that can further improve deposit base, increase presence in higher growth areas, or build wealth management business • Keep earnings consistent with 2021 by replacing PPP income and reserve releases with improved core earnings in 2022 resulting from organic balance sheet growth, leading to further earnings growth in 2023 • Enhance franchise value by continuing shift of MSBI model to relationship - based loans funded by low - cost deposits combined with growing wealth management business that provides large, consistent source of noninterest income 33

34 Long - Term Formula for Enhancing Shareholder Value Accretive M&A Transactions Earnings Growth, Improving Returns and Enhanced Franchise Value Disciplined Balance Sheet Growth Improving Operating Efficiencies Stable Sources of Recurring Income

35 APPENDIX

36 ESG: A Framework for Sustainability Environmental Facilities • Our Corporate HQ, built in 2011, is LEED (Silver) Certified. • We have installed solar power in 10 Midland locations. • We have made more than $50+ million of credit available for residential solar projects since 2011. • We have also completed more than $540 million of financing for 18 “green” (LEED, Energy Star, etc.) multi - family/health care facilities through our Love Funding subsidiary since 2017. Paper Reduction • More than 40% of our customers use paperless statements and Midland has had a digitization/paper elimination program in place since 2010. Social Community Outreach • Midland States Bank has been serving families and businesses in our communities for more than 140 years, offering products and services based on the needs of our customers. • We work with more than 150 low - to - moderate income (“LMI”) and minority focused community development groups in our banking markets to help insure our community development programs address the needs of each of our markets. • The Midland Institute CEO Program, a unique program designed to teach and create entrepreneurial opportunities to teens, was first created by our Bank in 2008 for the local Effingham, Illinois high schools and has now grown to be offered by 229 high schools in six states. Culture and People • Since 2008 Midland has provided all employees personal and professional development through an acclaimed third - party training company. • Midland’s Advanced Study for Talent Enrichment and Resource Training (“MASTERS”) program serves to develop future leaders of the Company. To date 59% of participants have been women or minority employees. • Midland launched its Diversity & Inclusion Council in April 2020 to focus on diversity in the workplace and workforce. Philanthropy • $30 million of investment towards community development goals targeted for the 2019 - 2021 period. Financial Education • Since 2015 we have held more than 240 financial literacy seminars in LMI/minority neighborhoods in our footprint. CRA, Community Development and Financial Inclusion • Through our Believable Banking® Residential Mortgage and Home Improvement Loan Programs we have made more than $31 million of loans to consumers underserved by traditional loan programs. • Our banking products and services are offered through our personal bankers and online with materials designed to clearly describe the features, costs and alternatives available to our customers, including through dual - language materials and our ADA compliant website. • Midland has provided $877 million of financing for 148 affordable multi - family and health care projects since 2015. Governance Reputation • Midland States Bank was one of the first in the nation to have a woman on its board (1903). • Our board composition includes 40% women and minorities, and our criteria for identifying directors includes seeking diverse individuals. Oversight of Strategy and Risk • The Company’s Chair and CEO roles been separate since the Company’s inception (1988). • Our Board of Directors has established a Risk and Compliance Committee to oversee all aspects of risk and compliance management. • Our ERM program evaluates risk in each of our businesses and operational departments, including asset and liability management, and our Chief Risk Officer reports directly to the Audit and Risk and Compliance Committees of the Company’s Board of Directors. Data Security • Robust data security programs and a Privacy Policy under which we do not sell or share customer information with non - affiliated entities. Management of Legal and Regulatory Environment • All continuing directors except our CEO are “independent” pursuant to applicable SEC/NASDAQ rules. • Our Executive Compensation, including all performance related compensation, is also evaluated under our ERM to ensure compliance with the FDIC’s Interagency Guidelines Establishing Standards for Safety and Soundness and the Sound Incentive Compensation Policies issued jointly by the federal financial institutions regulatory agencies. • All cash and equity incentive programs for executive officers include operating metrics and/or four - year vesting periods .

37 Paycheck Protection Program Overview Paycheck Protection Program (as of 12/31/21) Loans Outstanding $52.5 million Round 1 $5.3 million Round 2 $47.2 million Total Fees Earned $15.3 million Fees Recognized in 4Q21 $1.5 million Remaining Fees to be Recognized $2.0 million Impact on 4Q21 Financials At or for the Three Months Ended 12/31/21 Metrics Excluding PPP Impact Total Loans $5.23 billion $5.18 billion Average Loans $5.00 billion $4.90 billion Net Interest Income FTE (1) $54.7 million $53.1 million Net Interest Margin (1) 3.25% 3.19% ACL/Total Loans 0.98% 0.99% 1. Loan fees and deferred loan origination costs being amortized over an estimated 24 to 60 month life of PPP loans Paycheck Protection Program Loan Forgiveness As of 9/30/21 As of 12/31/21 Loans Submitted to SBA $313.9 million $342.4 million Loans Forgiven by SBA $300.8 million $333.0 million Percentage of Total Round 1 PPP Loans Forgiven 95.8% 98.1% Percentage of Total Round 1 and 2 PPP Loans Forgiven 79.1% 87.5%

38 Loan Deferral Overview Total Loan Deferrals As of Jun. 30, 2021 As of Sep. 30, 2021 As of Dec. 31, 2021 Total Loans Deferred $107.3 million $34.3 million $13.3 million % of Total Loans 2.2% 0.7% 0.3% Deferrals by Industry (as of December 31, 2021) Transit & Ground Passenger $3.1 23% Assisted Living $8.0 60% All Others <4% $2.2 17% ($ in millions) Deferral Type (as of December 31, 2021) Full Payment Deferral $1.4 million Deferred Loans Making I/O or Other Payments $11.9 million No remaining Hotel/Motel deferrals at 12/31/21

39 Capital and Liquidity Overview Capital Ratios (as of 12/31/21) Liquidity Sources (as of 12/31/21) 6.58% 8.08% 7.75% 9.16% 12.19% 10.49% 8.89% 10.49% 11.21% 0.00% 5.00% 10.00% 15.00% TCE/TA Tier 1 Common Tier 1 Leverage Tier 1 RBC Total RBC Consolidated Bank Level ($ in millions) Cash and Cash Equivalents $ 673.3 Unpledged Securities 409.1 FHLB Committed Liquidity 863.7 FRB Discount Window Availability 55.9 Total Estimated Liquidity $ 2,002.0 Conditional Funding Based on Market Conditions Additional Credit Facility $ 250.0 Brokered CDs (additional capacity) $ 500.0 Other Liquidity Holding Company Cash Position of $37.9 Million Holding Company Line of Credit of $15.0 Million

40 Appendix: Reconciliation of TBV Per Share 40 (dollars in thousands, except per share data) 2021 2020 2019 2018 2017 2016 2015 2014 Shareholders' Equity to Tangible Common Equity: Total shareholders' equity—GAAP 663,837$ 621,391$ 661,911$ 608,525$ 449,545$ 321,770$ 232,880$ 219,456$ Adjustments: Preferred stock - - - (2,781) (2,970) - - - Goodwill (161,904) (161,904) (171,758) (164,673) (98,624) (48,836) (46,519) (47,946) Other intangibles (24,374) (28,382) (34,886) (37,376) (16,932) (7,187) (7,004) (9,464) Tangible Common Equity 477,559$ 431,105$ 455,267$ 403,695$ 331,019$ 265,747$ 179,357$ 162,046$ Total Assets to Tangible Assets: Total assets—GAAP 7,443,805$ 6,868,540$ 6,087,017$ 5,637,673$ 4,412,701$ 3,233,723$ 2,884,824$ 2,676,614$ Adjustments: Goodwill (161,904) (161,904) (171,758) (164,673) (98,624) (48,836) (46,519) (47,946) Other intangibles (24,374) (28,382) (34,886) (37,376) (16,932) (7,187) (7,004) (9,464) Tangible Assets 7,257,527$ 6,678,254$ 5,880,373$ 5,435,624$ 4,297,145$ 3,177,700$ 2,831,301$ 2,619,204$ Common Shares Outstanding 22,050,537 22,325,471 24,420,345 23,751,798 19,122,049 15,483,499 11,797,404 11,725,158 Tangible Common Equity to Tangible Assets 6.58 % 6.46 % 7.74 % 7.43 % 7.70 % 8.36 % 6.33 % 6.19 % Tangible Book Value Per Share 21.66$ 19.31$ 18.64$ 17.00$ 17.31$ 17.16$ 15.20$ 13.82$ As of December 31,

41 (dollars in thousands, except per share data) Income before income taxes - GAAP $ 99,112 $ 32,014 $ 72,471 $ 50,805 $ 26,471 $ 50,431 Adjustments to noninterest income: Gain on sales of investment securities, net 537 1,721 674 464 222 14,702 Gain on termination of hedged interest rate swap 2,159 - - - - - Other income 48 (17) (29) 89 (67) (608) Total adjustments to noninterest income 2,744 1,704 645 553 155 14,094 Adjustments to noninterest expense: Impairment related to facilities optimization - 12,847 3,577 - 1,952 2,099 Loss (gain) on mortgage servicing rights held for sale 222 1,692 (490) 458 4,059 - FHLB advances prepayment fees 8,536 4,872 - - - - Loss on repurchase of subordinated debt - 193 1,778 - - 511 Integration and acquisition expenses 4,356 2,309 5,493 24,015 17,738 2,343 Total adjustments to noninterest expense 13,114 21,913 10,358 24,473 23,749 4,953 Adjusted earnings pre tax 109,482 52,223 82,184 74,725 50,065 41,290 Adjusted earnings tax 26,261 12,040 19,358 17,962 15,170 14,064 Adjusted earnings - non-GAAP $ 83,221 $ 40,183 $ 62,826 $ 56,763 $ 34,895 $ 27,226 Preferred stock dividends, net - - 46 141 83 - Adjusted earnings available to common shareholders - non-GAAP $ 83,221 $ 40,183 $ 62,780 $ 56,622 $ 34,812 $ 27,226 (dollars in thousands) Adjusted earnings pre tax - non- GAAP $ 109,482 $ 52,223 $ 82,184 $ 74,725 $ 50,065 $ 41,290 Provision for credit losses 3,393 44,361 16,985 9,430 9,556 5,591 Impairment on commercial mortgage servicing rights 7,532 12,337 2,139 (449) 2,324 3,135 Adjusted pre-tax, pre-provision earnings - non-GAAP $ 120,407 $ 108,921 $ 101,308 $ 83,706 $ 61,945 $ 50,016 Adjusted pre-tax, pre-provision return on average assets 1.75% 1.67% 1.74% 1.53% 1.57% 1.63% 20202021 2016 2016 For the Years Ended December 31, For the Years Ended December 31, MIDLAND STATES BANCORP, INC. Adjusted Earnings Reconciliation RECONCILIATIONS OF NON-GAAP FINANCIAL MEASURES (unaudited) 2019 201820202021 2017 20172018 Adjusted Pre-Tax, Pre-Provision Earnings Reconciliation 2019

42 Update (dollars in thousands) Noninterest expense - GAAP $ 175,069 $ 184,010 $ 175,641 $ 191,643 $ 152,997 $ 121,289 Adjustments to noninterest expense: Net expense from FDIC loss share termination agreement - - - - - (351) Impairment related to facilities optimization - (12,847) (3,577) - (1,952) (2,099) (Loss) gain on mortgage servicing rights held for sale (222) (1,692) 490 (458) (4,059) - FHLB advances prepayment fees (8,536) (4,872) - - - - Loss on repurchase of subordinated debt - (193) (1,778) - - (511) Integration and acquisition expenses (4,356) (2,309) (5,493) (24,015) (17,738) (2,343) Adjusted noninterest expense $ 161,955 $ 162,097 $ 165,283 $ 167,170 $ 129,248 $ 115,985 Net interest income - GAAP $ 207,675 $ 199,136 $ 189,815 $ 180,087 $ 129,662 $ 105,254 Effect of tax-exempt income 1,543 1,766 2,045 2,095 2,691 2,579 Adjusted net interest income 209,218 200,902 191,860 182,182 132,353 107,833 Noninterest income - GAAP 69,899 61,249 75,282 71,791 59,362 72,057 Adjustments to noninterest income: Impairment (recapture) on commercial mortgage servicing rights 7,532 12,337 2,139 (449) 2,324 3,135 Gain on sales of investment securities, net (537) (1,721) (674) (464) (222) (14,702) Gain on termination of hedged interest rate swap (2,159) - - - - - Other income (48) 17 29 (89) 67 608 Adjusted noninterest income 74,687 71,882 76,776 70,789 61,531 61,098 Adjusted total revenue $ 283,905 $ 272,784 $ 268,636 $ 252,971 $ 193,884 $ 168,931 Efficiency ratio 57.05% 59.42% 61.53% 66.08% 66.66% 68.66% 2016 For the Years Ended December 31, 2017 MIDLAND STATES BANCORP, INC. Efficiency Ratio Reconciliation RECONCILIATIONS OF NON-GAAP FINANCIAL MEASURES (unaudited) 2019 201820202021

43 (dollars in thousands, except per share data) Income before income taxes - GAAP $ 30,600 $ 25,431 $ 19,041 $ 24,040 $ 10,746 Adjustments to noninterest income: Gain on sales of investment securities, net - 160 377 - - Gain on termination of hedged interest rate swap 1,845 - - 314 - Other income - - (27) 75 3 Total adjustments to noninterest income 1,845 160 350 389 3 Adjustments to noninterest expense: Loss on mortgage servicing rights held for sale - 79 143 - 617 Impairment related to facilities optimization - - - - (10) FHLB advances prepayment fees 4,859 - 3,669 8 4,872 Integration and acquisition expenses 171 176 3,771 238 231 Total adjustments to noninterest expense 5,030 255 7,583 246 5,710 Adjusted earnings pre tax 33,785 25,526 26,274 23,897 16,453 Adjusted earnings tax 8,369 5,910 6,519 5,463 3,982 Adjusted earnings - non-GAAP $ 25,416 $ 19,616 $ 19,755 $ 18,434 $ 12,471 Adjusted diluted earnings per common share $ 1.12 $ 0.86 $ 0.86 $ 0.81 $ 0.54 Adjusted return on average assets 1.39% 1.15% 1.17% 1.11% 0.73% Adjusted return on average shareholders' equity 15.44% 11.94% 12.36% 11.97% 7.97% Adjusted return on average tangible common equity 21.65% 16.82% 17.52% 17.18% 11.50% (dollars in thousands) Adjusted earnings pre tax - non- GAAP $ 33,785 $ 25,526 $ 26,274 $ 23,897 $ 16,453 Provision for credit losses 467 (184) (455) 3,565 10,058 Impairment on commercial mortgage servicing rights 2,072 3,037 1,148 1,275 2,344 Adjusted pre-tax, pre-provision earnings - non-GAAP $ 36,324 $ 28,379 $ 26,967 $ 28,737 $ 28,855 Adjusted pre-tax, pre-provision return on average assets 1.98% 1.67% 1.60% 1.73% 1.69% December 31, 20202021 March 31, Adjusted Pre-Tax, Pre-Provision Earnings Reconciliation For the Quarter Ended June 30, 20212021 September 30, December 31, 2021 MIDLAND STATES BANCORP, INC. Adjusted Earnings Reconciliation RECONCILIATIONS OF NON-GAAP FINANCIAL MEASURES (unaudited) 2021 June 30, For the Quarter Ended March 31, 20212021 September 30, 2021 December 31, 2020 December 31,

44 (dollars in thousands) Noninterest expense - GAAP $ 45,757 $ 41,292 $ 48,941 $ 39,079 $ 47,048 Loss on mortgage servicing rights held for sale - (79) (143) - (617) Impairment related to facilities optimization - - - - 10 FHLB advances prepayment fees (4,859) - (3,669) (8) (4,872) Integration and acquisition expenses (171) (176) (3,771) (238) (231) Adjusted noninterest expense $ 40,727 $ 41,037 $ 41,358 $ 38,833 $ 41,338 Net interest income - GAAP $ 54,301 $ 51,396 $ 50,110 $ 51,868 $ 53,516 Effect of tax-exempt income 372 402 383 386 413 Adjusted net interest income 54,673 51,798 50,493 52,254 53,929 Noninterest income - GAAP 22,523 15,143 17,417 14,816 14,336 Impairment on commercial mortgage servicing rights 2,072 3,037 1,148 1,275 2,344 Gain on sales of investment securities, net - (160) (377) - - Gain on termination of hedged interest rate swap (1,845) - - (314) - Other - - 27 (75) (3) Adjusted noninterest income 22,750 18,020 18,215 15,702 16,677 Adjusted total revenue $ 77,423 $ 69,818 $ 68,708 $ 67,956 $ 70,606 Efficiency ratio 52.61% 58.78% 60.19% 57.14% 58.55% 2020 December 31, MIDLAND STATES BANCORP, INC. Efficiency Ratio Reconciliation RECONCILIATIONS OF NON-GAAP FINANCIAL MEASURES (unaudited) (continued) 2021 June 30, For the Quarter Ended March 31, 20212021 September 30, 2021 December 31,

45 (dollars in thousands, except per share data) Shareholders' Equity to Tangible Common Equity Total shareholders' equity—GAAP $ 663,837 $ 657,844 $ 648,186 $ 635,467 $ 621,391 Adjustments: Goodwill (161,904) (161,904) (161,904) (161,904) (161,904) Other intangible assets, net (24,374) (26,065) (27,900) (26,867) (28,382) Tangible common equity $ 477,558 $ 469,875 $ 458,382 $ 446,696 $ 431,105 Total Assets to Tangible Assets: Total assets—GAAP $ 7,443,805 $ 7,093,959 $ 6,630,010 $ 6,884,786 $ 6,868,540 Adjustments: Goodwill (161,904) (161,904) (161,904) (161,904) (161,904) Other intangible assets, net (24,374) (26,065) (27,900) (26,867) (28,382) Tangible assets $ 7,257,527 $ 6,905,990 $ 6,440,206 $ 6,696,015 $ 6,678,254 Common Shares Outstanding 22,050,537 22,193,141 22,380,492 22,351,740 22,325,471 Tangible Common Equity to Tangible Assets 6.58% 6.80% 7.12% 6.67% 6.46% Tangible Book Value Per Share $ 21.66 $ 21.17 $ 20.48 $ 19.98 $ 19.31 (dollars in thousands) Net income available to common shareholders $ 23,107 $ 19,548 $ 20,124 $ 18,538 $ 8,333 Average total shareholders' equity—GAAP $ 652,892 $ 651,751 $ 641,079 $ 624,661 $ 622,594 Adjustments: Goodwill (161,904) (161,904) (161,904) (161,904) (161,904) Other intangible assets, net (25,311) (27,132) (26,931) (27,578) (29,123) Average tangible common equity $ 465,677 $ 462,715 $ 452,244 $ 435,179 $ 431,567 ROATCE 19.69% 16.76% 17.85% 17.28% 7.68% Return on Average Tangible Common Equity (ROATCE) 2020 December 31, 2020 December 31, 2021 March 31, 2021 June 30, For the Quarter Ended 2021 September 30, 2021 December 31, MIDLAND STATES BANCORP, INC. Tangible Common Equity to Tangible Assets Ratio and Tangible Book Value Per Share RECONCILIATIONS OF NON-GAAP FINANCIAL MEASURES (unaudited) (continued) 2021 June 30, As of March 31, 20212021 September 30, 2021 December 31,